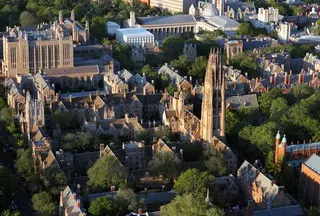
Columbia University Roy and Diana Vagelos College of Physicians and Surgeons Class Profiles by Year
Admission Changes by Gender
The men to women applicants ratio is 44 to 55 for the academic year 2025-2026. There are slightly more female applicants than male applicants at Columbia University. The proportion of men and women among matriculants is not significantly different at Columbia University.
Analyze the tables and charts below to check the change in the male to female ratio of applicants and matriculants at Columbia University.
Applicants and Matriculants Gender Ratio Changes
Year
Applicants
Matriculants
Acceptance Rate
Total
Men
Women
Total
Men
Women
Total
Men
Women
2021-2022
8,080
3,717 (46.00%)
4,355 (53.90%)
138
69 (50.00%)
69 (50.00%)
1.71%
1.86%
1.58%
2022-2023
7,008
3,161 (45.10%)
3,840 (54.80%)
138
64 (46.40%)
74 (53.60%)
1.97%
2.03%
1.93%
2023-2024
7,203
3,349 (46.50%)
3,803 (52.80%)
138
67 (48.60%)
71 (51.40%)
1.92%
2.00%
1.87%
2024-2025
7,291
3,237 (44.40%)
3,974 (54.50%)
138
65 (47.10%)
72 (52.20%)
1.89%
2.01%
1.81%
2025-2026
7,677
3,393 (44.20%)
4,199 (54.70%)
138
66 (47.80%)
71 (51.40%)
1.80%
1.94%
1.69%
Applicants and Acceptance Rate by Gender Changes (2021-2026) Chart
Admission Changes by Legal Residency
The in-state to out-of-state applicants ratio is 15 to 85 for the academic year 2025-2026. Among applicants, there are far more from out-of-state than from New York. at Columbia University.
Analyze the tables and charts below to check the change in the male to female ratio of applicants and matriculants at Columbia University.
Applicants and Matriculants by Legal Residency Changes
Year
Applicants
Matriculants
Acceptance Rate
Total
NY Residents
Out-of-State
Total
NY Residents
Out-of-State
Total
NY Residents
Out-of-State
2021-2022
8,080
1,277 (15.80%)
6,803 (84.20%)
138
30 (21.70%)
108 (78.30%)
1.71%
2.35%
1.59%
2022-2023
7,008
1,072 (15.30%)
5,936 (84.70%)
138
28 (20.30%)
110 (79.70%)
1.97%
2.61%
1.85%
2023-2024
7,203
1,109 (15.40%)
6,094 (84.60%)
138
24 (17.40%)
114 (82.60%)
1.92%
2.16%
1.87%
2024-2025
7,291
1,094 (15.00%)
6,197 (85.00%)
138
20 (14.50%)
118 (85.50%)
1.89%
1.83%
1.90%
2025-2026
7,677
1,175 (15.30%)
6,502 (84.70%)
138
16 (11.60%)
122 (88.40%)
1.80%
1.36%
1.88%
Legal Residency Changes (2021-2026) Chart
Tuition Increase from 2021 to 2027
The Columbia University's 2027 tuition & fees is $79,690, $4,001 (5.29%) higher than last year's tuition. Compared to the amount 7 years ago, this year's tuition is $12,392 (18.41%) higher.
The following table and chart visualize the increase of tuition & fees at Columbia University from 2021 to 2027.
Columbia University Tuition Changes (2021-2027)
Year
Tuition & Fees
2020-2021
$67,298
2021-2022
$69,258 2.91%
2022-2023
$69,363 0.15%
2023-2024
$73,511 5.98%
2024-2025
$72,564 -1.29%
2025-2026
$75,689 4.31%
2026-2027
$79,690 5.29%
Columbia University Roy and Diana Vagelos College of Physicians and Surgeons Tuition & Fees Trends (2021-2027) Chart
MCAT Score and GPA from 2022 to 2026
The 2026 MCAT score at Columbia University is 521. The MCAT score remained the same as last year. Compared to the MCAT score 5 years ago, the score has stayed the same, showing minimal change overall.
The following table and chart visualize the changes of MCAT scores at Columbia University from 2022 to 2026.
Columbia University GPA and MCAT Scores Changes (2022-2026)
MCAT Score
GPA
2021-2022
521
3.91
2022-2023
518 -3
3.72 -0.19
2023-2024
522 4
3.90 0.18
2024-2025
522
3.95 0.05
2025-2026
521 -1
3.85 -0.10
Columbia University MCAT score Trends (2022-2026) Chart
Enrollment Changes from 2022 to 2026
A total of 644 students enrolled in Columbia University with 313 men and 329 women students. The men to women student ratio is 49 to 51 at Columbia University.
The following table and chart visualize the changes of student population at Columbia Universityfrom 2022 to 2026.
Columbia University Total Enrollment Changes (2022-2026)
Total
Men
Women
2021-2022
655
345
310
2022-2023
645 -10
329 -16
316 6
2023-2024
642 -3
332 3
310 -6
2024-2025
643 1
321 -11
321 11
2025-2026
644 1
313 -8
329 8
Columbia University Enrollment Changes (2022-2026) Chart